Why Sebago Lake Water Levels Change: The Dam, the Seasons & the Shoreline
Why does Sebago Lake rise and fall? Explore the watershed, Eel Weir Dam history, the changing operating rules, and practical effects on boats, docks, beaches, and shoreline habitats.
A familiar rock disappears. A beach becomes wider. A dock that worked in June needs another look in September. Around Sebago Lake, a change of a foot can be the difference between an easy departure and a boat that should stay tied up.
The explanation is not simply that someone opened a dam. Sebago Lake’s water level reflects the balance between water entering and leaving a large watershed, shaped by a regulated outlet and the needs of the Presumpscot River downstream. Rain, snowmelt, dry weather, evaporation, water withdrawals, and dam operations all belong in the story.
Understanding that balance makes the lake less mysterious. It also helps explain why the same water level can be welcome at a marina, worrying beside an eroding bank, and important to a river habitat miles away.
The short answer: why does Sebago Lake rise and fall?
Sebago rises when incoming water exceeds outgoing water and falls when the reverse happens. Its outlet is regulated through the Eel Weir Hydroelectric Project. Regulation changes how water leaves the lake, but it cannot manufacture rainfall or make a long dry spell disappear.
There are five things to keep in mind:
- The watershed supplies the water. Rain and melting snow reach Sebago directly and through streams, rivers, and connected lakes.
- The outlet is managed. Releases affect both the lake and the Presumpscot River.
- The river still needs water during dry weather. Lake storage is not reserved exclusively for boating or shoreline use.
- The operating rules have changed. The old seasonal target schedule should not be presented as today’s complete rulebook.
- Lake elevation is not local depth. A gauge reading cannot tell you whether your boat will clear a particular rock, piling, or ramp.
The widget refreshes daily from USGS station 01063995, Sebago Lake near North Windham. Check the observation time: this is a daily snapshot of the latest available measurement, not a live feed or a daily average. The explanation below provides the context behind the number.
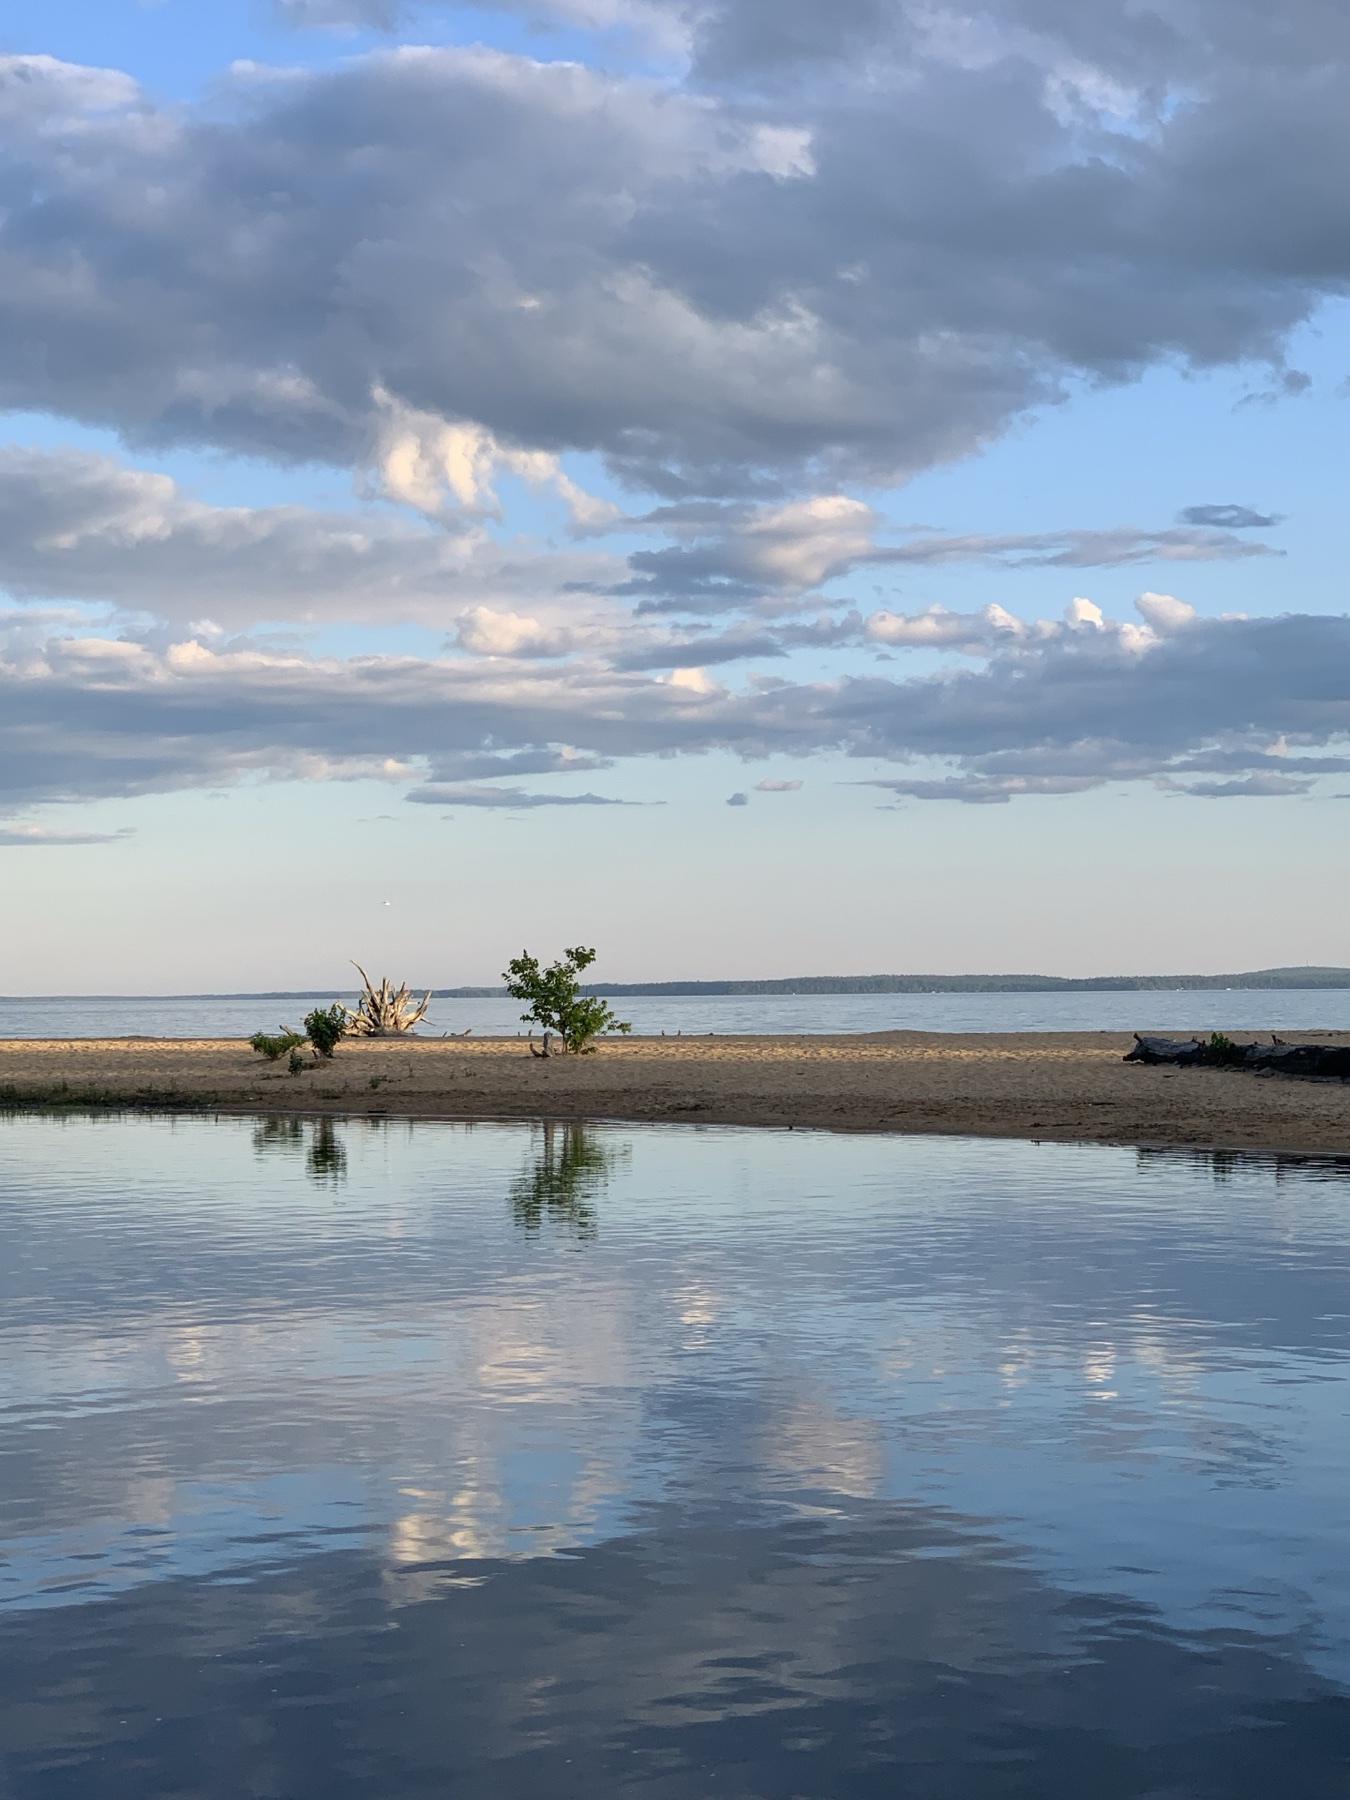
Looking across the sandy shoreline near the Songo River entrance toward Sebago Lake. Photograph supplied by Visit Sebago Lake.
Where the water comes from, and where it goes
Sebago is part of a drainage system much larger than the lake itself. Portland Water District describes a watershed extending roughly 50 miles northwest toward Bethel. Conditions in that wider area matter: a shower over your camp is not a reliable measure of how much water the whole system received. Portland Water District’s watershed overview is a useful starting point.
The basic accounting is straightforward:
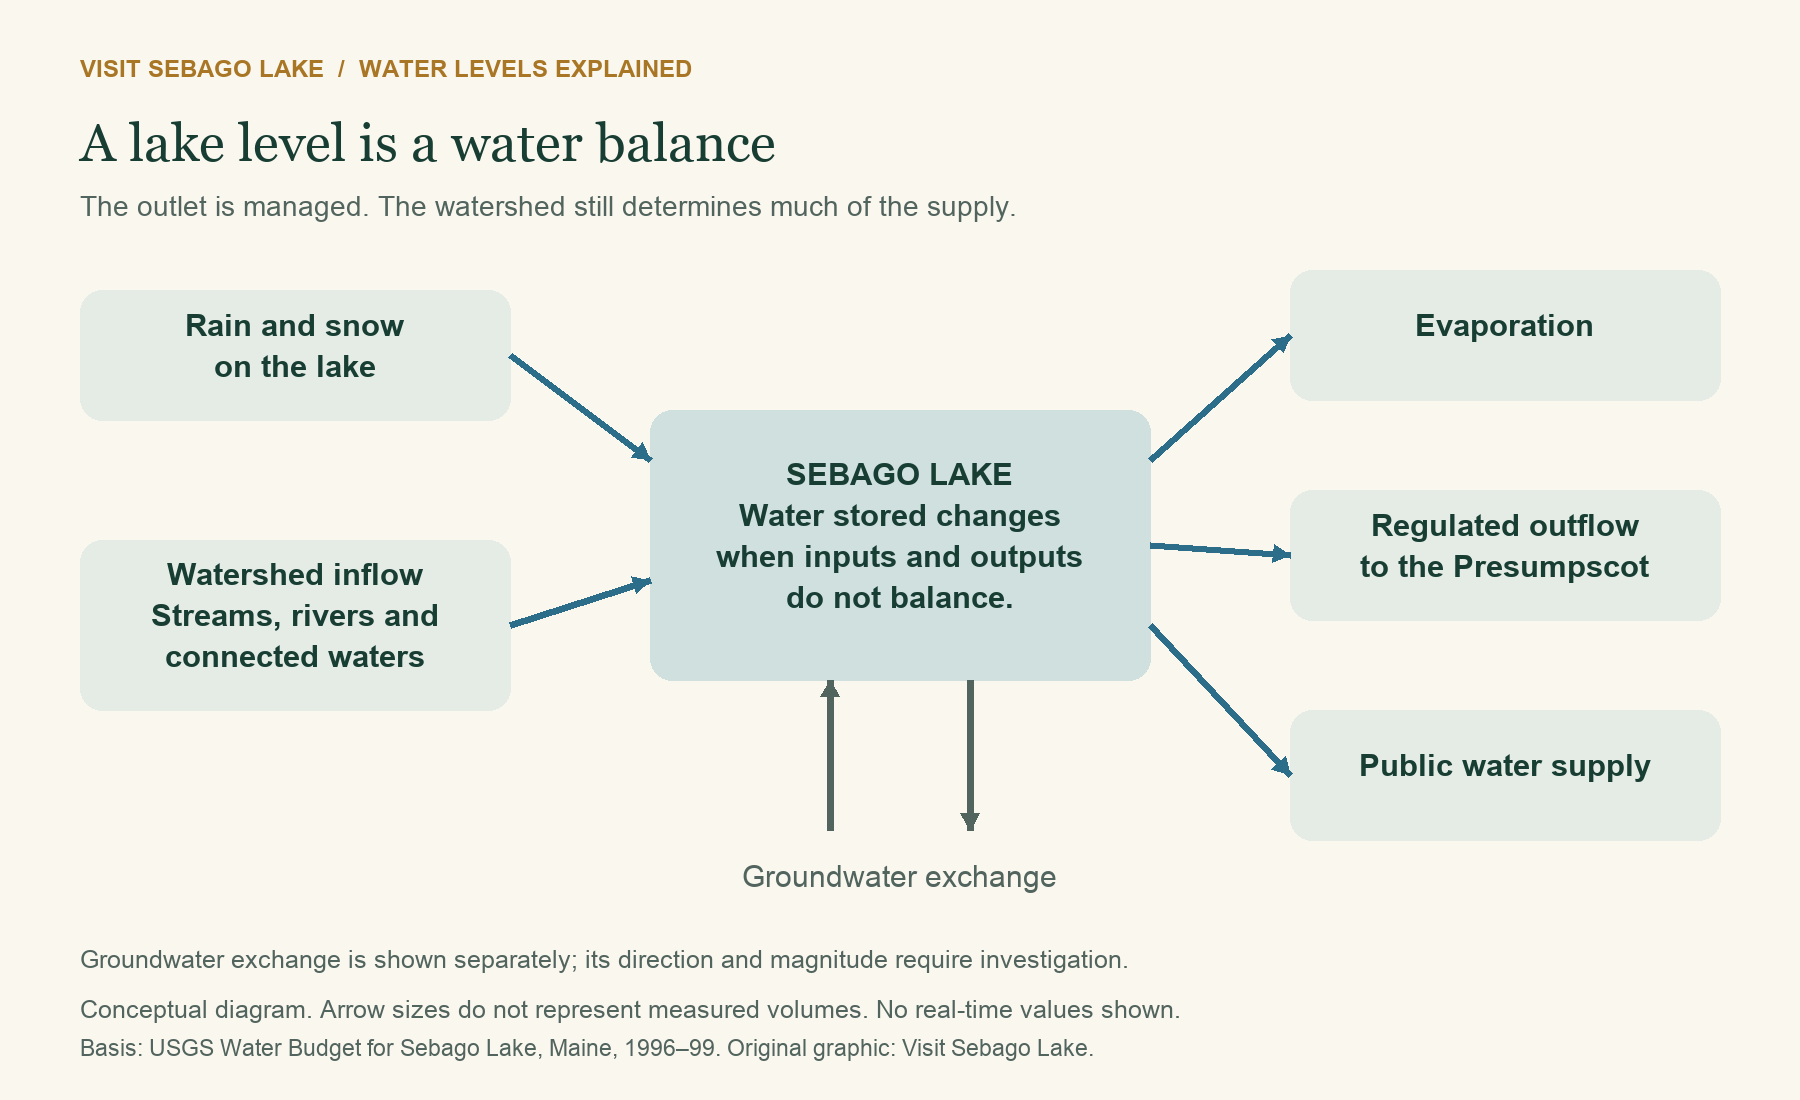
Water entering, minus water leaving, changes the amount stored in the lake.
Rain falls onto the water and surrounding land. Some runs into tributaries; some enters the soil and moves more slowly. Snow holds water until it melts. Streams and connected waters deliver that supply on different schedules. Water leaves through the outlet, evaporates from the lake surface, and is withdrawn for public water supply. Groundwater exchange can also matter, although it is harder to measure.
USGS studied Sebago’s water budget for water years 1996–1999. Surface-water inflow accounted for about 84 percent of the measured mean annual inflow budget, and surface-water outflow for about 87 percent of the mean annual outflow budget. The study also reported an unresolved budget residual, with groundwater not directly computed. Those are findings from that study period, not a precise accounting for every later year. They show why river inflows and outflows deserve attention alongside direct rainfall. USGS water-budget study
Does Portland’s drinking water lower the lake?
Water-supply withdrawals are part of the balance, but they are not the whole explanation for a falling lake. PWD’s published watershed summary lists average outflow figures of 24 million gallons per day for the district, 425 million for the Presumpscot River, and 49 million for evaporation. These are broad published averages, not today’s operating flows or a closed real-time budget.
The district also makes an important distinction: it monitors the lake but does not operate the outlet to control its level. Supplying drinking water and managing the dam are different responsibilities. PWD water-level information
Who controls Sebago Lake’s water level?
Water leaving Sebago Lake is managed by the operators of the Eel Weir Hydroelectric Project. The companies named in FERC’s May 2025 notice are Presumpscot Hydro LLC and Relevate Power Maine LLC. They manage releases from the lake, but they cannot simply choose a water level and hold it there regardless of the weather. How much water arrives from the watershed still matters. Federal project notice
The operators also work within rules established by the Federal Energy Regulatory Commission, or FERC, and water-quality conditions set by Maine DEP. Those requirements account for more than the view from a lakeside dock: water released from Sebago also supports the Presumpscot River downstream. Portland Water District has a different role. It draws drinking water from Sebago and monitors the lake, but it does not control the dam. PWD’s explanation
If you remember Sappi or S.D. Warren managing the lake, that reflects the project’s history. Some older pages also use the name Dichotomy Power Maine, which changed to Relevate Power Maine. That is why older articles can name a different company even when they are discussing the same outlet. For current operating questions, use Maine DEP or the latest contact listed for FERC Project P-2984. Federal record of the name change
Which dam actually controls the lake?
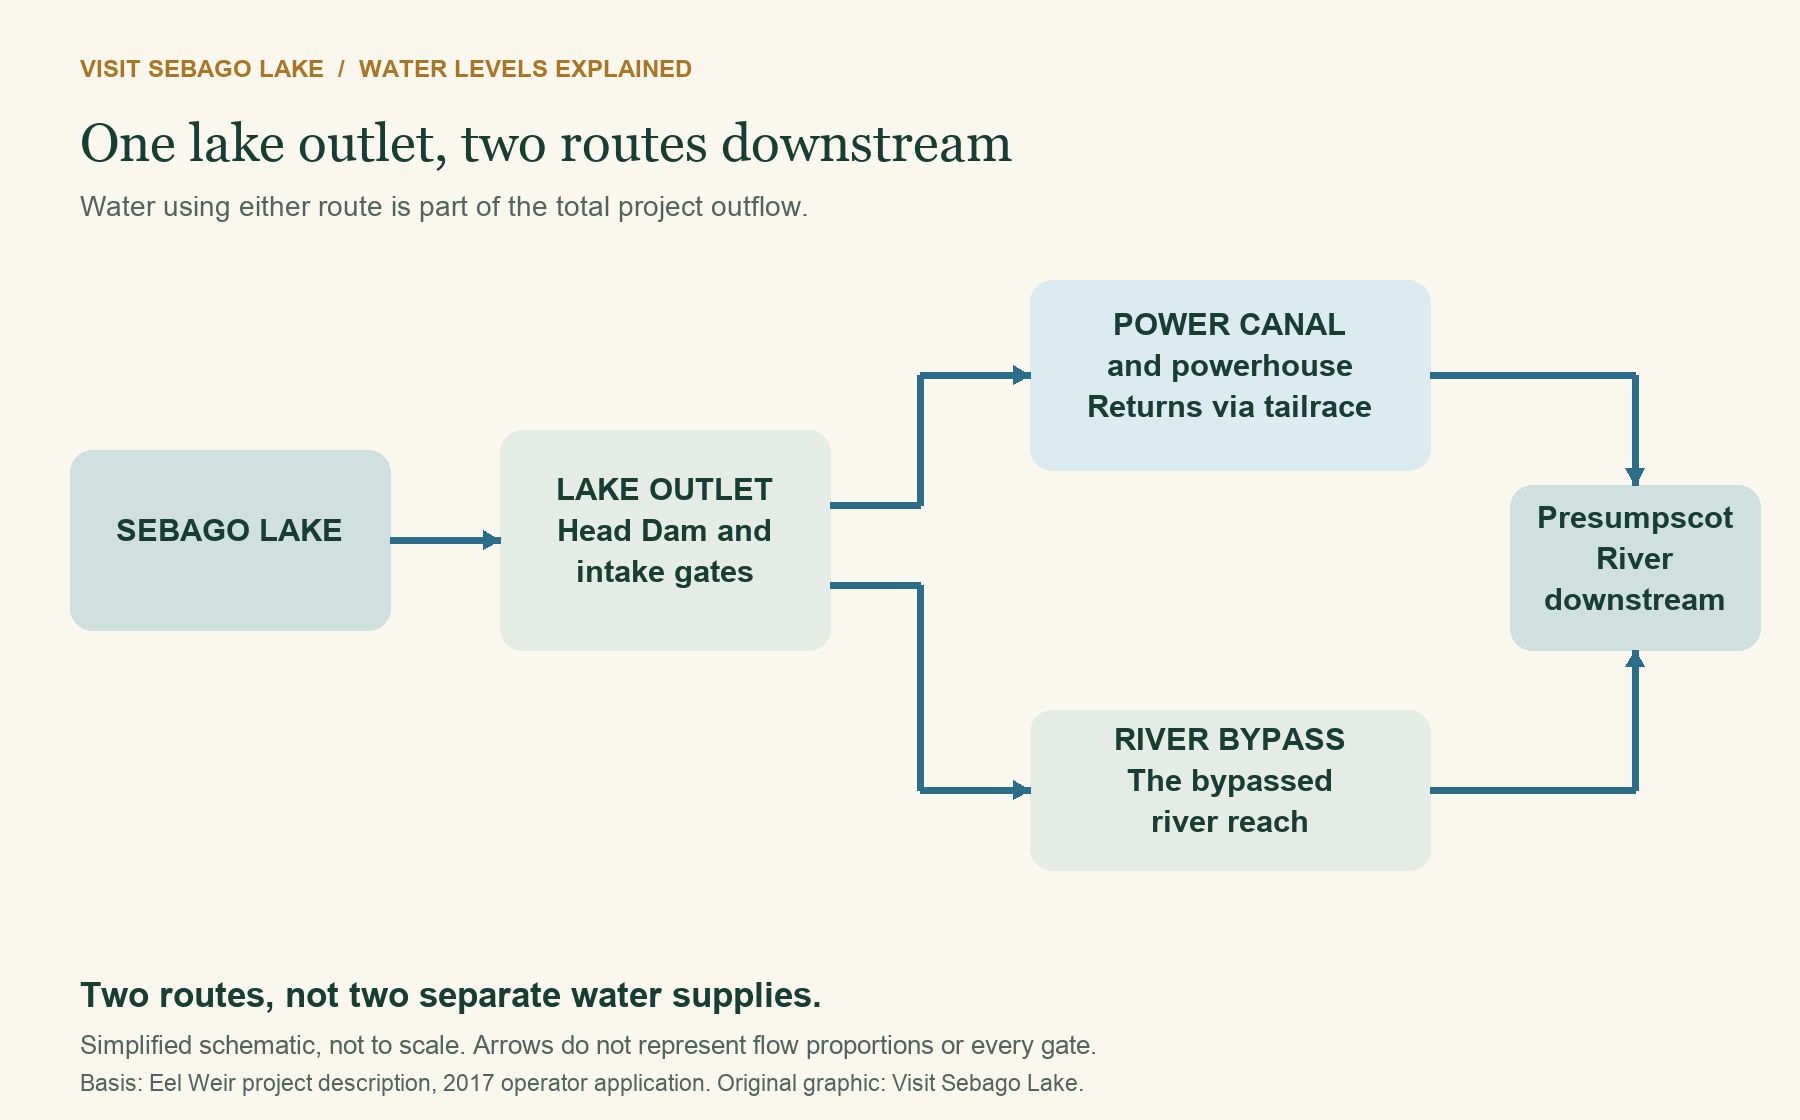
The lake-outlet structure is commonly described as the Head Dam, headgates, or Basin Dam, within the Eel Weir project. The project also includes a power canal, a downstream powerhouse, and the river reach bypassed by the canal.
That distinction matters. A photograph of the powerhouse is not necessarily a photograph of the structure holding back Sebago. Water sent through the canal and powerhouse still leaves the lake; water released into the bypass takes a different route downstream. Both routes belong in the project’s total outflow.
The simplest way to picture it is as an outlet with two paths. One carries water through the power canal and generating station before returning it to the river. The other carries water through the bypassed river reach. Water leaving by either path is part of the lake’s total outflow.
From canal navigation to a regulated hydropower system
Sebago is a natural lake. Its modern outlet regulation is human-made, with roots in the canal era rather than recreational boating alone.
Sources differ slightly on the earliest dam date. PWD places the first Eel Weir dam around 1827 and says the headwater structure reached its present height in 1884. Maine Geological Survey’s historical account dates the Basin Dam’s construction to 1830 and connects it to the Cumberland and Oxford Canal Company. The careful conclusion is that outlet regulation developed during the late-1820s/1830 canal-building period, not that every part of today’s project was completed in one year. PWD history, MGS historical study
The canal-era purpose was to improve navigation and divert water into the canal. Later, stored lake water became valuable to downstream industry and hydropower. The operator’s 2017 application dates initial powerhouse operation to 1903, illustrating why the dates for the outlet dam and the generating station should not be interchangeable.
The modern regulatory milestones are equally important:
- 1984: FERC issued the original federal project license, as described in the Maine court record.
- 1997: FERC approved a lake-level management plan, later amended in 2000 and 2001.
- 2011: Maine DEP issued the water-quality certification used in relicensing.
- 2015: FERC issued a new 40-year license, adopting a flow-based operating framework rather than simply retaining the old schedule.
- 2016: The project’s Operations and Flow Monitoring Plan received FERC approval, according to the later operator filing.
- 2025: Federal notices used the newer co-licensee names while reviewing proposed equipment and transmission changes.
The first two milestones are documented in the Maine court’s review of the certification proceedings. The later operating changes are documented in the license and operator application. A notice reviewing an equipment proposal is not, by itself, proof that a new lake-level regime has been approved.
How the operating rules changed
Older explanations describe specific seasonal elevations and a deeper winter drawdown in two out of every nine years. That history is real. However, quoting those provisions without explaining the 2015 change can give readers the wrong expectation for a particular August, November, or winter.
The 2014 environmental assessment describes the older approach, while the 2015 licensing decision adopts the newer one. Even within a single regulatory document, sections labeled “current operation,” “proposed operation,” “staff recommendation,” and the final order may describe different arrangements. A number appearing in an old report is not automatically a requirement today.
The key elevations in the newer framework
The 2015 license incorporates a managed target range of 262.0 to 266.65 feet, expressed in the project’s mean-sea-level terminology, with a 266.0-foot goal between May 1 and June 15. Levels outside the range trigger adjustments to releases. The conditions include exceptions for extreme hydrology and other specified circumstances. This is not a promise of constant depth or an absolute barrier against flood or drought. 2015 license, Appendix A, Condition 1
The spillway reference and the spring goal are different numbers. Nor does the entire target range represent a forecast that the lake will traverse all of it every year. Maine’s March and September 2026 water-management reports continue to identify the 262.0–266.65-foot range. March 2026 report, September 2026 report
Why water still leaves when the lake looks low
The Presumpscot needs flow for aquatic habitat and water quality. The licensing framework sets total-project and bypass requirements. The operator’s 2017 application summarizes a 270-cubic-feet-per-second total minimum, with a conditional increase to 408 cfs during June–September when downstream dissolved-oxygen conditions require it. Bypass requirements are part of total release, not water added on top of it. Applicable exceptions and later approved operating provisions must also be considered.
Reaching 262 feet does not automatically stop releases or mean minimum-flow requirements have only just begun. The lake-level target range and the minimum river-flow requirements are separate parts of the operating framework. 2015 license, Appendix A, Conditions 1–2
Flow-based does not mean uncontrolled, and it does not mean a strictly run-of-river project. Storage and release remain part of how the system works. The operator’s application explicitly distinguishes the project from run-of-river operation. Operating-plan explanation and flow requirements
Retaining every gallon for lake users would affect the river. Releasing water without regard to the lake would affect the shore and access. The rules sit between those competing needs. This guide explains that framework; it is not an operational instruction or a finding that a particular day’s operation complies with it.
What changes through the seasons?
Winter and spring: the timing of water matters
A snowy landscape stores some precipitation until thaw. Rain can move through the watershed sooner, while a rapid melt can deliver water in a shorter period. How much reaches the lake, and when, depends on conditions across the drainage area rather than simply on snow depth beside one dock.
Spring can therefore bring a rising lake, but a refill is not guaranteed on a preferred boating date. A dry preceding season, limited snow storage, or the timing of runoff can change the starting point. The dam influences release; it cannot replace an absent watershed supply.
Summer: lake use and water demand overlap
Summer brings boating, swimming, public water use, evaporation, and the river’s warm-weather needs into the same conversation. A dry spell reduces incoming water while several routes of loss remain. A lake can decline even when operators have reduced releases within the applicable requirements.
Fall: lower water, rain, and storms can all be part of the picture
By fall, a summer deficit may still be visible. Rain can slow or reverse that decline, but a wet afternoon need not erase weeks of reduced inflow. Reservoir and lake response takes place over different timescales.
Cold weather does not switch evaporation off. Water can continue evaporating while an open lake is warmer than cold, dry air passing over it. This is a general physical process, not a measured explanation for any particular Sebago drawdown. The International Joint Commission’s explanation of water-level influences describes the relationship between precipitation, seasonal supply, evaporation, and short-term wind effects.
Storms: storage helps, but it is not unlimited
An outlet has finite capacity. If incoming storm water arrives faster than it can safely leave, lake storage and elevation increase. A dam is not a drain capable of holding a large lake perfectly steady during every event.
Wind adds another complication. Waves run higher on individual shores, and wind can temporarily push water toward one side of a lake. That local movement is not the same thing as the entire lake gaining the same amount of stored water. Photographing wave runup beside a bank and reading a lake gauge answer related, but different, questions.
What actual lake-level records show
The three complete calendar years below offer a useful illustration of variability without pretending to define every possible year.
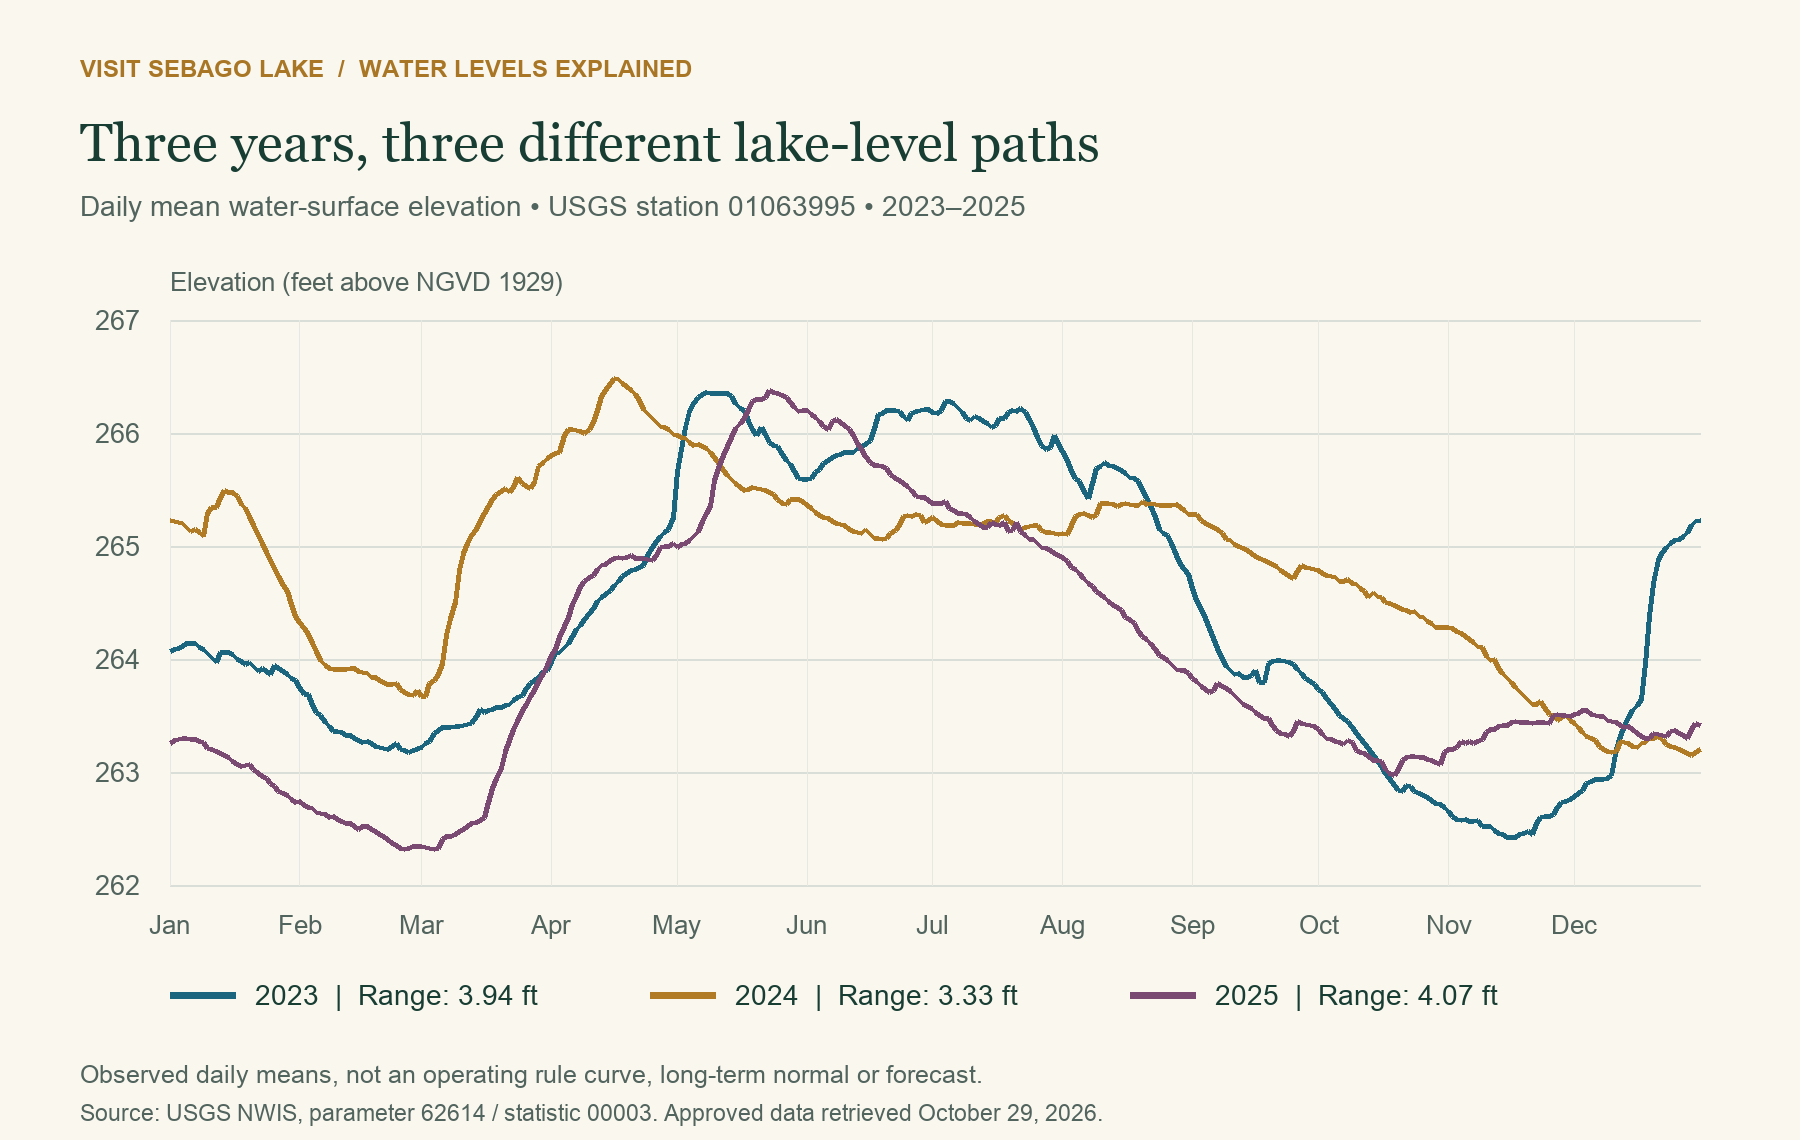
Original VSL chart using USGS daily mean elevation data, parameter 62614, statistic 00003, station 01063995. Units are feet above NGVD 1929. All 1,096 retrieved daily values were marked approved at retrieval on October 29, 2026. These are observations, not a rule curve or a forecast.
The daily-mean annual high-to-low ranges in this dataset were 3.94 feet in 2023, 3.33 feet in 2024, and 4.07 feet in 2025. These calculations describe those calendar years only. They are not instantaneous extremes, a long-term normal, a measure of percent-full storage, or evidence of an operating violation.
The timing matters as much as the range. A lake’s lowest point need not occur on the same date every year, and two years can follow different paths even if their total annual ranges look similar. That is why comparing today’s number only with a summer photograph is less useful than looking at the dated gauge record. USGS source data for this chart
What the lake gauge tells you that a depth finder does not
Boaters use depth finders to assess the water beneath their boat. The lake gauge answers a different question: has Sebago’s water surface risen or fallen, and by how much?
For example, if the gauge shows the lake is a foot lower than on your last visit, there is generally a foot less water over the same unchanged bottom. That can help explain why your depth finder reads less near a familiar dock, why a sandbar looks larger, or why retrieving a boat is harder than it was earlier in the season. It is an explanation of the change, not a clearance calculation for every spot.
Your depth finder remains useful on the water. Check what its displayed number represents: depending on installation and settings, it may show depth below the transducer, below the waterline, or below the keel. Follow your equipment’s instructions rather than assuming the number always means clearance beneath the boat. Manufacturer explanation of depth offsets
The gauge is useful before you leave home and for following the season. Look at the latest reading, its measurement time, and the recent trend. A number such as 263 feet is the elevation of the lake surface above a survey reference, not 263 feet of water under your boat. USGS identifies that reference as NGVD 1929.
Why a small vertical change can move a beach a long way
The shoreline is where water meets the land surface. On a steep rock face, a one-foot change may move that intersection only a short distance. On a flat sandy shelf, it can move it much farther.
A simple geometry example makes the point. On a hypothetical, uniform 1:20 slope, a one-foot fall moves the water’s edge about 20 feet horizontally. On a 1:5 slope, the same fall moves it about five feet. These are explanatory calculations, not measured slopes or predictions for a Sebago beach.
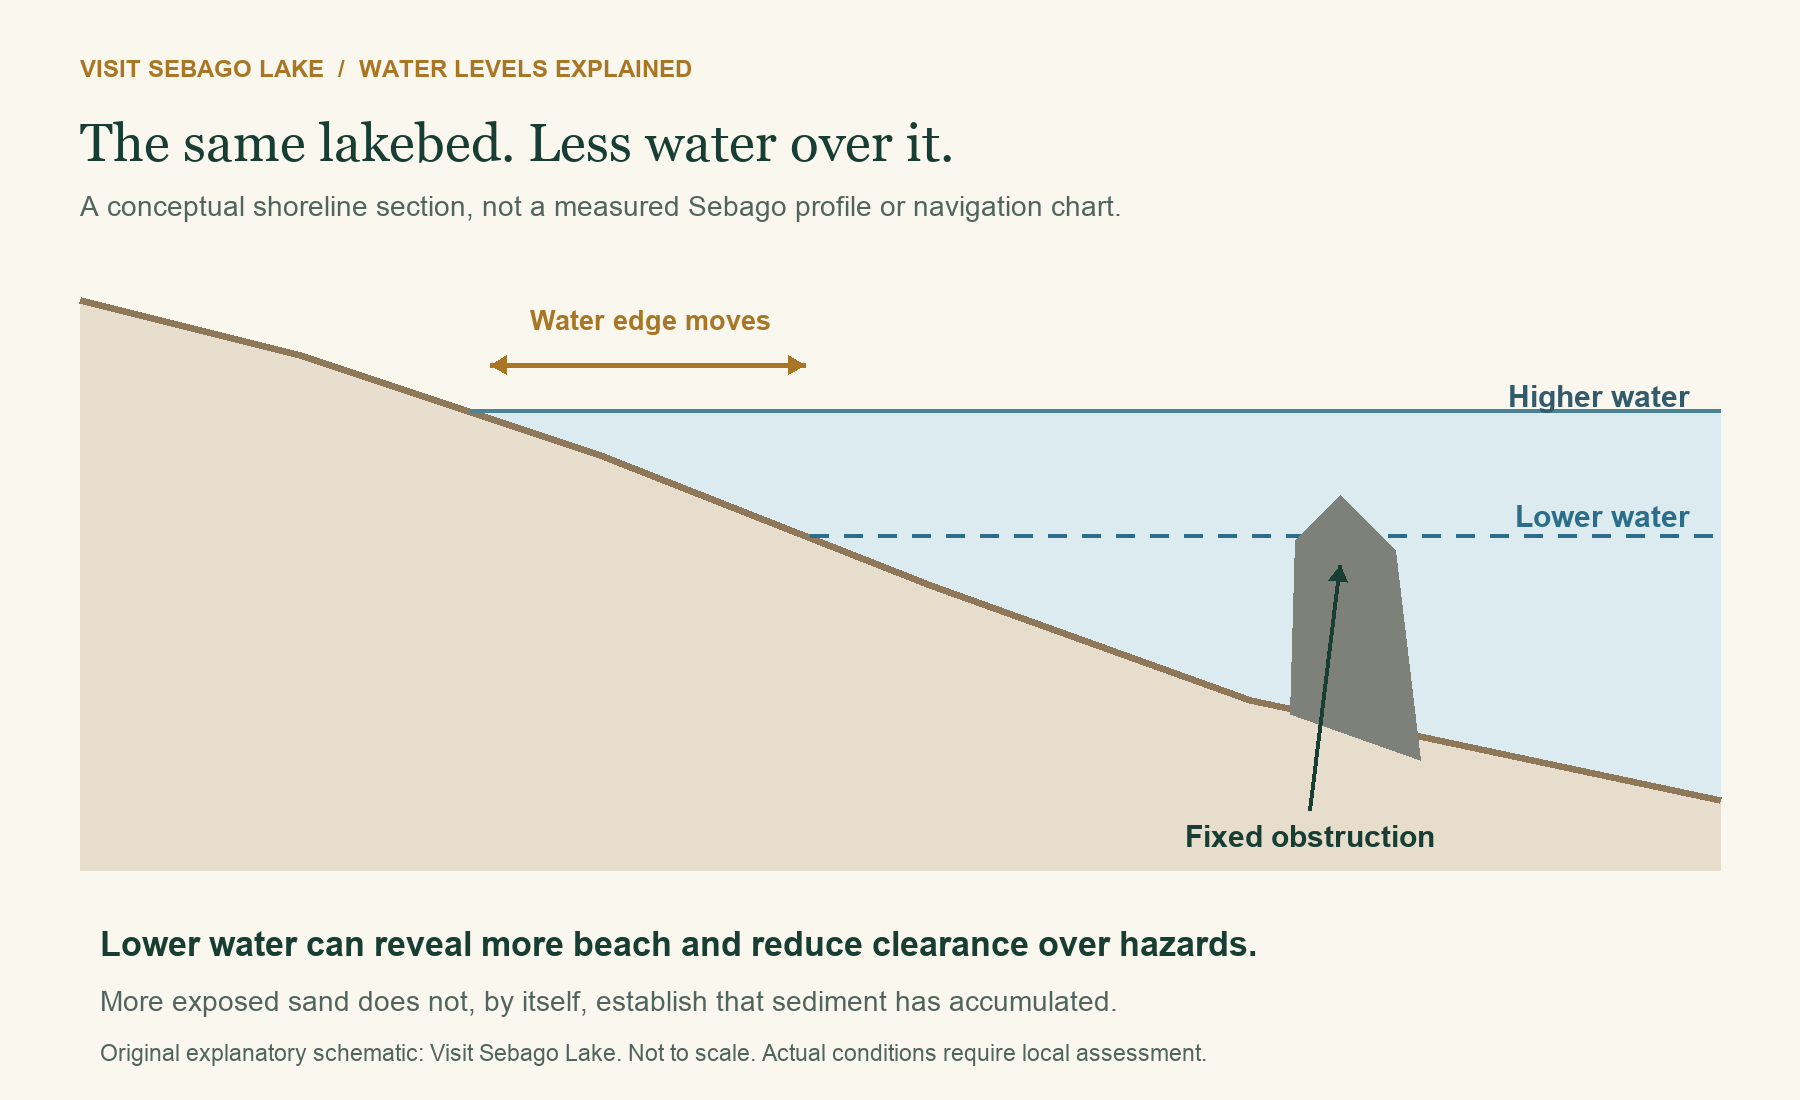
Original schematic, not to scale and not a navigation chart. The bed and obstruction stay in place while two possible water levels are shown. Actual bottoms, sediment movement, waves, and vessel clearance require site-specific assessment.
More visible sand does not necessarily mean new sand arrived. The water may simply have retreated. Conversely, a narrow visible beach does not prove that the same amount of sediment has permanently disappeared. To establish erosion or accretion, compare repeated measurements or photographs tied to known positions and water levels.
What changing levels mean for boating
Clearance changes even when the route looks familiar
A rock, sandbar, or submerged timber does not need to move to become a more immediate hazard. If the surface falls while the bottom stays fixed, clearance decreases. An old successful GPS track records where you traveled, not a guarantee of safe depth on a later date.
At the Songo entrance, changing water levels are one part of a setting that also includes shallow deposits and historic submerged structures. Our Songo River pilings history explains that local context. Neither article establishes a safe track through the entrance or certifies the position of current markers.
Treat navigation aids as important information, not a guaranteed depth survey. Learn the meanings of Maine’s channel, obstruction, and danger markers through the Bureau of Parks and Lands navigation-aids guide. Check current local conditions and the requirements of your particular boat rather than treating a photograph, a buoy, or another vessel’s passage as proof of clearance.
Ramps, slips, and retrieval can become the limiting factor
Having sufficient water offshore does not establish that you can launch, reach your slip, or get back onto a trailer. Inspect the ramp and approach, ask the operator about current suitability, and plan retrieval before committing to a trip. Do not back beyond the supported end of a ramp in an attempt to find more depth.
For planning, start with our boat-launch guide and confirm details with the facility. Low water affects different sites differently; an open listing is not a promise that a particular boat can use it.
Docks and moorings need attention in both directions
At lower levels, boats can ground near a dock and access angles can change. At higher levels, fixed docks, gangways, mooring arrangements, and nearby electrical equipment can face different problems. Whether a dock floats, rests on legs, or is permanently fixed changes what needs inspection.
Have the dock or mooring provider assess the installation for the actual site and equipment. A familiar seasonal routine is useful, but it should not replace checking what the lake is doing this year. There is no single lake-wide gauge number at which every boat, dock, or ramp becomes safe or unsafe.
What changing levels mean for shorelines and beaches
High water can let waves reach the upper beach, roots, and erodible material that ordinary waves do not reach. Wind direction, wave exposure, bank material, vegetation, and the duration of high water help determine the outcome.
MGS’s 1990–1997 shoreline work recorded major damage associated with the fall 1996 storm period. It documented the importance of the combination of strong wind and high lake level, including exposed roots and toppled trees at studied shorelines. This is evidence of a specific process and period, not proof that every later erosion problem has one cause. MGS study and archive record
Lower water can move wave action away from a vulnerable upper bank, but “lower is always better” is not a sound general rule. Maine DEP notes that large changes can concentrate erosion below an established protective cobble layer, affect sediment exposure, and disturb shoreline habitats. Different shore materials respond differently. DEP water-level guidance
Water level is also not the only source of sediment loss. Runoff from land, foot traffic, vegetation removal, and disturbance associated with access or dock handling can matter. A useful shoreline assessment looks at the whole site, including what happens during storms, rather than assuming the dam explains every bare patch.
Songo Beach shows why the effects matter
In 2024, Maine’s Bureau of Parks and Lands and PWD described a living-shoreline demonstration at Songo Beach. The account connects intense wind, waves, and high water with erosion and explains the use of rootwads, logs, brush, fabric-wrapped soil, and native planting. It also describes monitoring rather than presenting the work as a finished, universally proven solution. State park shoreline-restoration account
That distinction is worth keeping: changing the lake level and repairing a damaged shoreline are related management questions, but neither automatically solves the other. Sediment and nutrients moving into nearshore water are part of why this is a lake-health issue as well as a property concern.
Exposed shore is not permission to alter it
Low water can make a work area accessible, but it does not itself authorize dredging, adding sand, removing vegetation, installing a wall, or moving lakebed material. Before planning shoreline work, consult Maine DEP and your town’s code enforcement office about applicable permissions, and check project-owner requirements where relevant.
Maine DEP’s OUR SHORE program explains nature-based stabilization and links to the current permitting guidance. Choose a site-specific approach rather than copying a wall or planting layout from another beach. This is a planning pointer, not a determination that a proposed project qualifies for a particular permit.
Fish, wetlands, and the river have a stake too
Nearshore shallows and wetlands are habitat, not spare storage without consequences. The timing, speed, and duration of a water-level change can affect nesting, spawning, vegetation, and animals that use the lake margin. Maine DEP highlights effects on fish, waterfowl, amphibians, mussels, and other shoreline wildlife; the response depends on the species and the season.
The Presumpscot also needs flow when lake users would prefer to retain water. The license includes seasonal bypass flows and an autumn flow cap intended to protect landlocked salmon. These provisions explain why “just close the gates” is not a complete answer to a low lake. They do not establish that a particular fish event was caused by lake-level management. Federal license and conditions
How to judge a claim about an unusually high or low lake
A photograph can show an impact. A gauge can show a level. Neither alone identifies the cause or proves that a rule was broken.
Before attributing a change, ask:
- What was the lake elevation, and how had it changed over days and weeks?
- Was the comparison made at the same site, reference point, and season?
- What were rainfall, snowmelt, and tributary conditions across the watershed?
- What releases were reported, and were they total-project or bypass-only flows?
- Was an exception, maintenance activity, or emergency modification in effect?
- Is the explanation quoting the old seasonal plan or the later operating framework?
For a specific operating concern, request the relevant monitoring records and any deviation reports through the regulator or operator. For shoreline damage, keep dated photographs from a consistent safe location, note the gauge reading and weather, and seek a qualified site assessment. Report immediate danger through the appropriate emergency channel rather than waiting for an article or social-media discussion to resolve it.
Questions people ask about Sebago Lake water levels
Are lake levels measured in winter too?
Yes. The USGS Sebago Lake station records water levels through the year, including winter, rather than only during boating season. The daily records used for this article contain observations for every day of 2023, 2024, and 2025. Equipment or reporting interruptions can still occur, so check the timestamp rather than assuming a displayed reading is current.
Is Sebago Lake deliberately drained every fall?
Regulated outflow contributes to changes in storage, but the seasonal appearance also reflects the supply arriving from the watershed and other losses. Today’s framework should not be reduced to the old schedule or described as an automatic fall drain to one guaranteed elevation.
Does the “two out of nine years” rule still explain low water?
That provision belongs to the older lake-level plan. The 2015 license replaced that framework with flow-based operation. An older FAQ repeating the phrase is not sufficient evidence that a particular current winter has been designated for that drawdown.
What is full pond at Sebago Lake?
The project documents commonly use the 266.65-foot spillway crest as the full-pond reference, while the newer framework has a 266.0-foot spring goal. Always identify the vertical reference before comparing those numbers with another gauge, survey, chart, or informal shoreline marker.
Is a reading near the low end a sign the lake is almost empty?
No. Lake-surface elevation and the amount of usable water at a shallow access point are not the same as the percentage of total lake volume remaining. Shoreline inconvenience can be substantial without meaning that a deep lake is close to empty.
Why not keep the lake at the best boating level all year?
There is no single level that optimizes every dock, beach, habitat, river requirement, and storm-storage need. In addition, available water changes. The dam operator manages within constraints rather than choosing freely from an unlimited supply.
Where can I see the current lake level?
Use the USGS station page and check its timestamp and parameter. For the wider weather and water-supply picture, use Maine’s Drought Task Force reports. A “today” figure copied into an undated article can quickly become misleading.
One lake, several legitimate needs
The view from a dock is personal: enough water to leave safely, a beach for the afternoon, or a bank you hope will survive the next storm. The view from the outlet includes those concerns and a river that continues downstream.
Sebago’s changing level is the visible result of that larger system. Knowing the gauge, the watershed, the operating history, and the limits of any single explanation is more useful than choosing between “all weather” and “all the dam.” Both natural supply and human management matter, and the effects are felt most sharply where the water meets the shore.
Sources and further reading
- USGS station 01063995: current elevation, measurement details, and access to historical observations.
- USGS daily data used for the 2023–2025 chart: original observation series, not a third-party tracker.
- USGS, Water Budget for Sebago Lake, Maine, 1996–99: measured budget components and uncertainties.
- PWD, Sebago Lake and lake-level information: watershed context and the distinction between monitoring and control.
- FERC, March 23, 2015 license: final licensing decision, project description, and water-quality conditions; especially printed pages 17–18 and Appendix A. Hosted copy of a federal document.
- FERC, 2014 supplemental environmental assessment: historical alternatives, shoreline studies, and operating analysis. Recommendations are not interchangeable with the final license.
- Operator’s September 2017 LIHI application: project layout, 2016 operating-plan references, and implementation explanations. Historical operator account, not an independent compliance finding for today.
- FERC’s January 2025 and May 2025 notices: co-licensee names and proposed project changes.
- MGS, Summary of Sebago Lake Shoreline Change Studies, 1990–1997: historical field evidence, with an accessible archived text.
- Maine DEP, Water Level Management and OUR SHORE: ecological tradeoffs and shoreline planning.
- Maine Bureau of Parks and Lands, Songo Beach restoration account: local restoration and monitoring context.
- Maine Drought Task Force and River Flow Advisory Commission reports: dated regional water-management updates.
Research reviewed October 29, 2026. Regulatory explanations should be checked against later project orders, approved operating plans, and temporary modifications before being used to evaluate a specific operation. This guide is not a navigation chart or a certification of access, shoreline condition, or regulatory compliance.